My two cents on Tencent
Below is for educational purposes only, not intended as trading advice.
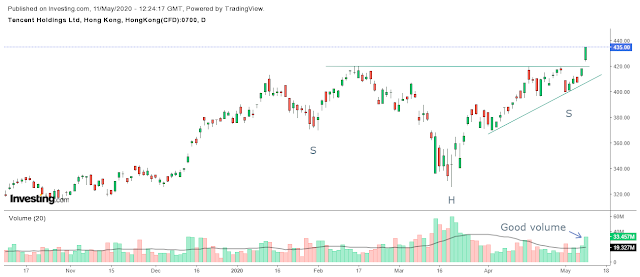
Tencent chart shows an uptrend on the daily (and weekly and monthly), a possible inverse head and shoulders pattern was confirmed today with the price breaking above the neckline on good volumes.
This is surprising because the benchmark of Tencent's listing (the Hang Seng) is not showing a similar enthusiasm as of date.
The rise from its recent lows is sketchy, with its upward ventures seeming laborious that are shot down in quick bursts. While it does show higher highs and higher lows, the scale seems to be declining. The size of the candlesticks seems to be muted suggesting that the market may be indecisive.
Can Tencent be the outlier from the broader market, especially given that it is the largest component of the Hang Seng Index with a 10.75% weighting? Perhaps. But I would prefer to hold off until the market confirms the rise. Technical analysis is best used to better one's odds.
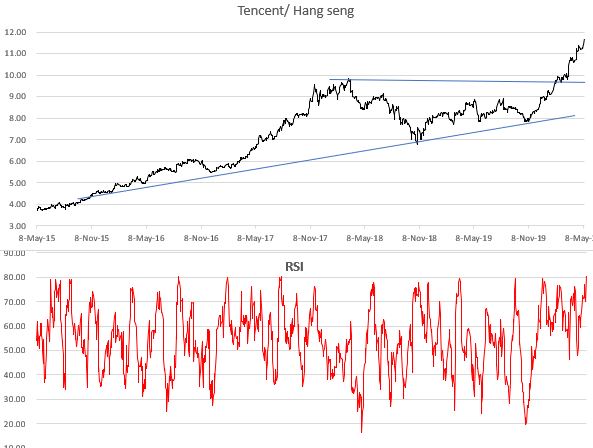
It is worth noting that Tencent has extended beyond historical out-performance high over its benchmark. The RSI of this out-performance (self calculated) is now in the overbought zone. However, this is not enough of a reason to have a bearish view on the stock, as stocks can remain over valued and over bought for extended periods of time.
So I tried to identify supply zones where from the stock could reverse its advance. I am not at all proficient in identifying these zones, so it is a trial and error exercise. Note that I have not come across any single authoritative way of marking these zones in my limited research.
Supply zone:
To start identifying the supply zones I go "up and left" from the current price point and try to identify areas from where price has seen some spirited rejection.
Monthly supply zone (432-477):
In Jan 2018, the stock topped out on the monthly chart. In Feb 2018 the stock to stay flat closing nearly half way into Jan 2018's green candle's body forming a dark cloud cover. The candle after this for Mar 2018 was a bearish inverse hammer, before which the price was pushed below this zone and the downtrend began.
I believe the first stutter than the uptrend was broken was in Feb 2018. Though the dark cloud cover was confirmed only April 2018 when the stock closed below the low of the original green candle on whom the DCC was formed (which is the confirmation requirement of theDCC). It must be remembered that supply and demand zones are always identified with the benefit of hindsight, and therefore one must make use of all available information to identify these zones.
Weekly Supply zone (455-476):
Daily Supply zone (467-476):
How does one trade this?
The text in this blog has been changed, as my knowledge re demand/supply zones is updated. Since this blog is for my own education, I am keeping the older text below, if I feel the need to refer to it.
xxxxxxxxxxxxxxxxxxxxxxxxxxxxxxxxxxxxxxxxxxxxxxxxxxxxxxxxxxxxxxxxxxxxxxxxxxxxxxxxx
I believe the first stutter than the uptrend was broken was in Feb 2018. Though the dark cloud cover was confirmed only April 2018 when the stock closed below the low of the original green candle on whom the DCC was formed (which is the confirmation requirement of theDCC). It must be remembered that supply and demand zones are always identified with the benefit of hindsight, and therefore one must make use of all available information to identify these zones.
Weekly Supply zone (455-476):
Drilling down to the weekly data we have more colour on the movement of prices than the monthly. Again focus on the area just before the sharp decline in prices. Identify the swing high, and then look for the candle which marked the first stutter in prices.
The lower line of the range will always have a common price point with the candle or candles that succeeds it. In this case it is the green candle prior the tall swing.
The weekly supply zone is nested inside the monthly supply zone.
Daily Supply zone (467-476):
The daily supply zone that is nested within the weekly zone is marked in yellow below.
Ideally this is where the short trade should be take, because the price points of shorting, and of covering shorts are clearly marked. The shorts should be taken at the lower end (467) and if the trade goes against one, should cover at 476, at a loss of 1.93%.
How does one trade this?
The text in this blog has been changed, as my knowledge re demand/supply zones is updated. Since this blog is for my own education, I am keeping the older text below, if I feel the need to refer to it.
xxxxxxxxxxxxxxxxxxxxxxxxxxxxxxxxxxxxxxxxxxxxxxxxxxxxxxxxxxxxxxxxxxxxxxxxxxxxxxxxx
The inverse hammer was the point from where the stock price retreated fast. It thus represents the supply that swept away the demand for Tencent at this level. Hence the supply zone will begin at the high price and continue all the way to the low price. We will exclude the lower wick, because there was demand at the point, but it was insufficient to push the stock monthly close any higher.
It is interesting to note that the stock made attempts to penetrate the monthly supply zone five times (April, May, June 2018, with each high slightly deeper into the supply territory, and then in Jan and Feb 2020). On its 6th attempt the bulls managed to get Tencent to close inside the monthly supply zone in April 2020 and so far in May 2020.
Unlike support and resistance lines, demand and supply zones do not get 'stronger', the more often they are touched. Repeated attempts actually weaken the zone as demand or supply is eroded away.
As such one can conclude that the monthly supply zone is not fresh, and less able to reject forays into its territory.
Weekly supply zone (436-476):
Now lets look at the weekly supply zone, in pale yellow (super-imposed over the blue monthly supply zone).
There was a large red candle after which the stock price showed a precipitous decline suggesting that that final candle had taken out all the demand for Tencent at this level. The last demand for the stock at this level can be seen from the two green candles marked. I include the upward window between the two candles as demand as well. The supply zone is thus from the high of the big red candle, to the open of the first of the two green candles before it. Because this is the final demand that was taken out.
We can see that the Tencent price (@ 435) is now just under the weekly supply zone (@ 436), and given that the weekly supply has been tested just once almost immediately after it was formed in 2018, and as such it is quite fresh. Very likely that Tencent will be sold as it enters this zone.
Daily supply zone (456-476):
We identify the point from which the stock has had a sharp decline, labelled key point below. The daily zone in bright yellow is nested inside the weekly zone.
We draw a channel from the swing high of the key point, because that is the most that anyone was willing to pay for it, before being taken out by an onslaught of supply. The zone will continue till the open of the prior green candle, because that was the last demand that Tencent saw before the price decline. Note that this area has been touched just once immediately after formation. and is a relatively fresh supply zone.
How does one trade this?
I had initiated a paper trade in Tencent, by shorting it at 421, and had a stop loss at 431.46. This was taken out today for a loss of 2.48%.
Given the sharp move up today on good volumes, I would short the stock at 439 (just above the 438.6 high it had reached when it had first penetrated into this weekly supply zone. I would set the stop loss at 456.56, which is a 4% hard stop.
Lets see.


Comments
Post a Comment